How to create predictive analysis using Microsoft Azure Machine Learning
This is self driven learning post where I'll walk through very simple steps to create a prediction model using Microsoft Azure Machine Learning. Azure ML Studio is having plenty of features and you just needs to drag right things and configure. Couple of clicks actually help you to reach your goal, and that's why I love Microsoft so much! Okay, let's stat.
First, all we have to do, is to visit https://studio.azureml.net/ to create the experiment using your favorite browser.
Now, we need data on which the prediction needs to implement. To do so, click on DATASETS on the left navigation. You are no on My DATASETS TAB.

You can use existing DATSETS(data) as well, if you want to. Clicking on Samples TAB allow you to do so.

Okay, now click on "+" icon on the botton to create a new DATASET.


Next is going to create a new Experiment. Same way, simple click on Experience Tab and click on "+".

Select blank experiment from there and proceed.

Newly create experiment dashboard is ready. Now, go to DATASET and drag newly uploaded CSV file on the DATSET box..

By default the name of the experiment shows as 'Experiment Created on...". You can simple select the text and change it by whatever name you want.

My next step is to visualize the data. Right click on the DATASET and go to dataset >> visualize


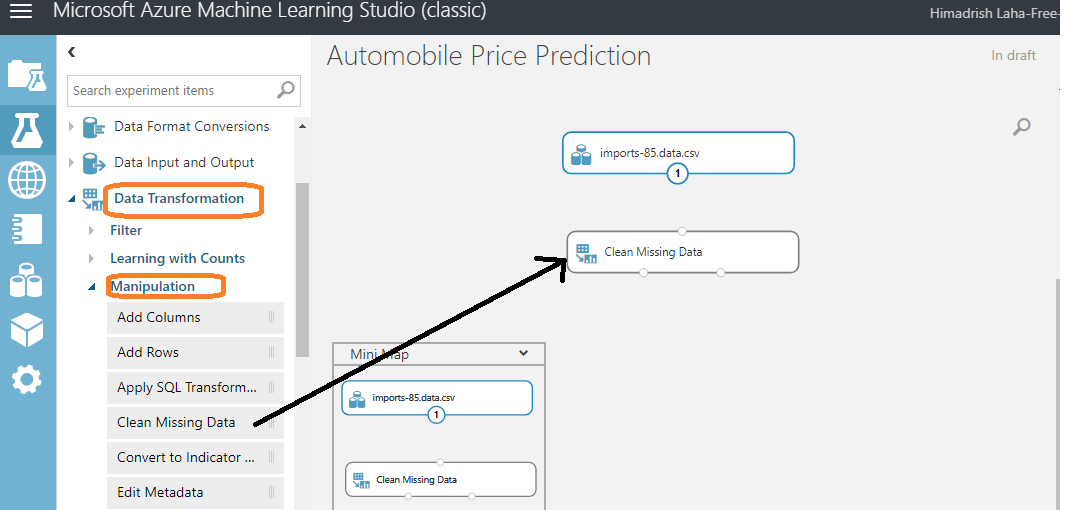
Here, we are going to configure the Clean Missing Data module to fill in the missing columns of data. This would be done by using the properties for the module. Clicking the column selector and then select the column (or you can let all columns). Here, I select the column normalized-loss as I see most of this column data(numeric type) is missing. There are many cleaning mode, and here I choose replacing missing data with median value of the selected column.

Next step is to insert a Project Columns module to allow us to selectively include or exclude columns of data from our initial DATASET. You can search this simply on the left hand side search box, and drag it in dashboard, or you can get this from Data Transformation >> Manipulation. Now, you can drag and drop it below the Clean Missing Data module and attach it to one of the bottom two connectors on the Clean Missing Data module.

The Project Columns module is to configured for including or excluding columns. To do this, simply click the Project Columns module and launch the column selector. Now, select Exclude and Column Names, and select the bore and stroke columns for exclusion. The assumption here is that the columns named bore and stroke will have no material impact on the prediction model and therefore do not need to be included in the input DATASET.

The next step is to add a Split module to our experiment so we can divert a certain percentage of our dataset for training purposes. As before, you can find this module by typing Split into the search bar on the top of the left navigation bar.
Now, click the Split module and set the parameter for the Fraction Of Rows In The First Output Dataset to .80. Here, .80 means that we use 80 percent of the data in the csv dataset for training our model.

Okay, now our next step is to search Train Model module and add it below the Split module. As usual, you can search it from neft navigation, or you can drag it from Machine Learning >> Train. The Train module needs to know which column in the dataset is to be used for the prediction. Configure the column selector by selecting Include, selecting Column Names, and adding the price column for training.

The next step is to find and add the Linear Regression module to the dashboard. Now, connect the bottom of the Linear Regression module to the top right of the Train module as below picture. We are ready now.

Now, save this experiment and then Run it.

During the time it is running, you can see what steps it is going through. Completed steps marked as a green check appears to the right of each module

Now, you model creation is done. you can publish this as webservice as well. People can check calling your service and providing other data and can get the predictive price data. To proceed, click on 'Setup Web Service' >> 'Update Predictive Experiment'.

In next screen, click on Run.

Once run finished, you can publish this service to gallery by clicking the link.

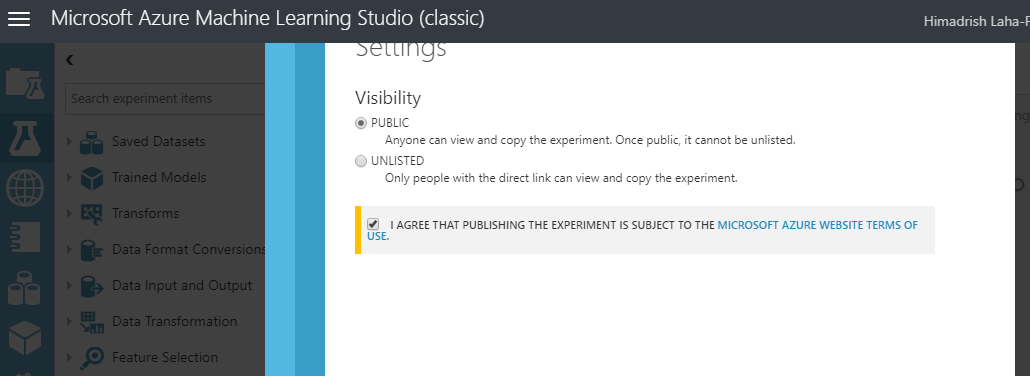
Need to provide a few information about your service in the Publishing UI, and here you can add any image/icon for your service as well.

Click on I agree checkbox and click to publish.
Service is now getting publish in the gallery.

Here we go...it is saying the web service is getting publish and here the url.

Good luck!


Comments
Post a Comment